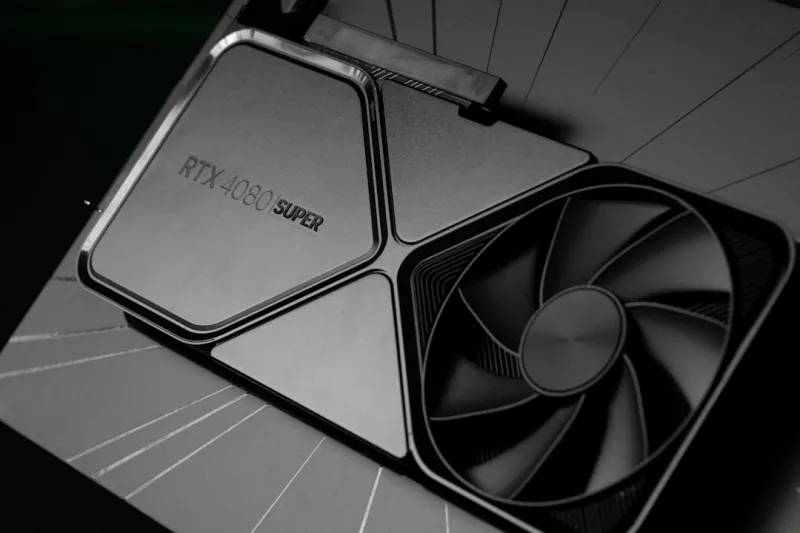
When I first cracked open a GPU back in the early 2020s, the whole process felt like a ritual—screwdriver, static wrist strap, and a healthy dose of optimism. Fast‑forward to 2026, and the ritual has become a high‑stakes dance with silicon that’s not just rendering frames but also crunching AI tensors, handling real‑time ray tracing, and even managing cryptographic workloads for secure communications. The stakes are higher, and the margin for error is razor‑thin. A single misstep in driver versioning, power delivery, or thermal management can cripple a workstation that a graphic designer or a data‑scientist depends on daily. That’s why I’m writing this deep‑dive: to arm you with a systematic, battle‑tested approach that cuts through the noise and gets your video card humming again—whether you’re building a rig for indie game development or a powerhouse for AI research.
Understanding the Modern GPU Landscape
Today's GPUs are hybrid beasts, packing thousands of cores, dedicated ray‑tracing units, and even on‑die AI accelerators. In 2026, manufacturers like NVIDIA and AMD have integrated tensor cores that accelerate everything from image upscaling to natural language processing. This convergence means that troubleshooting a “graphics” issue often requires a broader view of the system’s workload profile. For instance, a sudden frame‑rate dip might not be a classic rendering bottleneck but a symptom of an overloaded tensor core handling a machine‑learning inference task. Moreover, the rise of PCIe 5.0 and new power delivery standards means that power integrity and firmware compatibility have become front‑line concerns. Ignoring these nuances can lead to misdiagnoses that waste time and money. By recognizing the GPU as a multi‑purpose compute engine, you set the stage for a more precise and efficient troubleshooting workflow.
Common Symptoms and What They Reveal
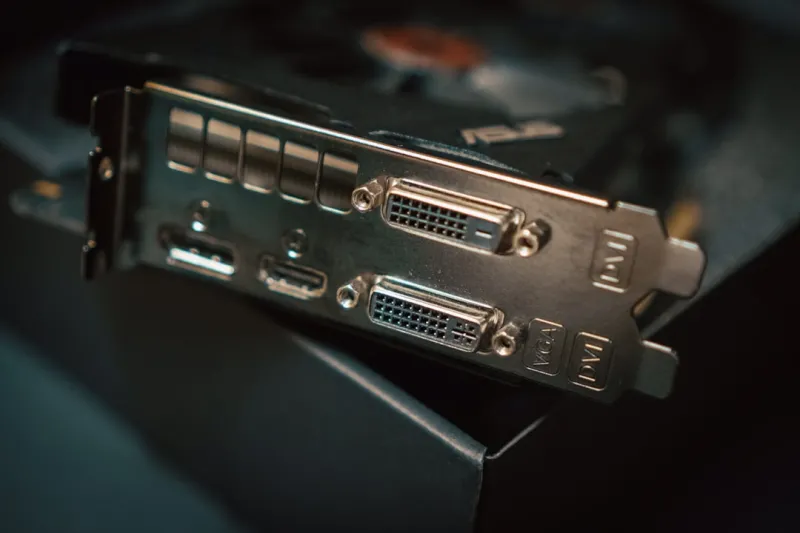
The first clue often comes in the form of visible symptoms: screen flicker, driver crashes, artifacting, or a complete black screen. Each of these tells a different story. Flickering usually points to a timing issue, perhaps a mismatched refresh rate or a faulty DVI/HDMI cable. Driver crashes, especially those that dump a .dmp file, often indicate a software‑hardware mismatch—maybe an outdated driver trying to communicate with a new BIOS setting. Artifacting—those strange geometric patterns you see in games—typically signals thermal overload or a failing VRAM module. A black screen, meanwhile, can be the most ominous, hinting at a power delivery failure or a broken PCIe lane. As a seasoned troubleshooter, I always start by cataloging the symptom, the context (what software was running, recent updates), and any recent hardware changes. This systematic capture prevents you from chasing red herrings and helps you prioritize the most likely culprits.
Step One: The Software Layer—Drivers and OS
The software stack is the most mutable part of the GPU ecosystem, and it’s also the easiest to reset. Begin by confirming you’re running the latest stable driver from the manufacturer’s website. In 2026, both NVIDIA’s GeForce Experience and AMD’s Radeon Software have introduced AI‑driven driver optimizations that adapt on‑the‑fly, but they can also introduce regressions. Roll back to a known‑good driver version if you’ve recently updated. Next, verify that Windows—still the dominant OS for gaming and professional workloads—has all the latest patches. A recent Windows update can inadvertently break driver signatures or alter power management policies. Use the built‑in Device Manager to check for any warning icons next to the display adapter, and run dxdiag to ensure the DirectX diagnostics report no anomalies. If the problem persists, create a fresh Windows user profile to rule out corrupted user settings interfering with GPU operation.
Step Two: Power Delivery and Physical Connections
Even the most polished driver cannot compensate for insufficient power. Modern GPUs often draw 300 W or more, and the PCIe 5.0 spec now supports up to 600 W with proper cabling. Start by inspecting the power connectors—both the 6‑pin/8‑pin modular cables and any auxiliary connectors the card might use. Look for signs of wear, burnt pins, or loose clips. Use a multimeter to confirm that each rail delivers the expected voltage under load; a drop of even 0.1 V can trigger instability. Next, check the PCIe slot itself. Dust accumulation can cause poor contact, and the slot’s spring tension can loosen over time. Carefully reseat the GPU, applying even pressure until you hear a subtle click. Finally, ensure your PSU is rated for the total system load, including the GPU, CPU, and any additional peripherals like NVMe drives that also draw power from the same rails.
Step Three: Thermal Management and BIOS Settings
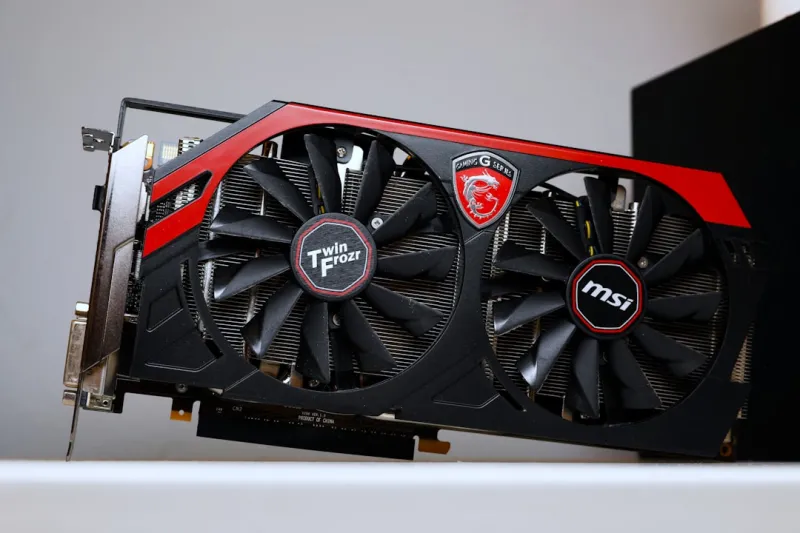
Heat is the silent killer of modern GPUs. In 2026, many cards feature dual‑fan or even liquid‑cooling solutions that rely on sophisticated firmware to balance performance and acoustics. Open your GPU’s monitoring suite—MSI Afterburner, EVGA Precision X, or the built‑in vendor utility—to check real‑time temperature, fan curves, and clock speeds. If temperatures exceed 85 °C under load, consider reapplying thermal paste or cleaning the heatsink fins. Also, delve into the BIOS settings of your motherboard. Enabling “Above 4G Decoding” and ensuring “Resizable BAR” is correctly configured can improve data throughput but may also introduce instability if mismatched with the GPU’s firmware. Updating the GPU’s BIOS (sometimes called VBIOS) should be a last resort, but it can resolve compatibility issues with newer motherboards that weren’t around when the card shipped.
Advanced Diagnostics: Leveraging Specialized Tools
When the basics don’t cut it, it’s time to bring in the heavy artillery. Tools like GPU‑Z provide granular insight into clock speeds, memory timings, and voltage curves, allowing you to spot anomalies that generic utilities miss. Run a stress test with FurMark or Unigine Heaven while monitoring for sudden spikes or drops in performance. If the system crashes, capture the dump file and analyze it with WinDbg to see if the fault originated in the kernel‑mode driver (dxgkrnl). For AI‑focused workloads, Nvidia’s Nsight Systems can trace tensor core activity, revealing if a specific kernel is overloading the GPU. Document every test result in a spreadsheet; patterns often emerge after multiple iterations. By building a data‑driven picture of the GPU’s behavior, you can isolate whether the issue is hardware‑level, firmware, or a specific software workload.
When All Else Fails: Learn From the Community
If you’ve exhausted the steps above and the GPU still refuses to behave, don’t go it alone. The community around GPU troubleshooting is incredibly active, and there are resources that can save you hours. For instance, the article Why Your GPU Keeps Crashing and How to Fix It Fast outlines a concise checklist that many professionals swear by. Likewise, the broader discussion in Why Video Card Troubleshooting Is More Critical Than Ever highlights emerging challenges with AI workloads that can affect even the most stable rigs. Engaging on forums, sharing your diagnostic logs, and even reaching out to the manufacturer’s support with a clear summary often leads to firmware patches or RMA approvals you wouldn’t get otherwise. Remember, a well‑crafted support ticket that references specific test results can dramatically accelerate the resolution process.
Future‑Proofing Your Build: A Forward‑Looking Perspective
Looking ahead, the line between GPU and dedicated AI accelerator is blurring. As we see in Building a Future‑Ready PC in 2026: Hardware Trends You Can’t Ignore, upcoming platforms will integrate more on‑die memory, higher bandwidth interconnects, and even unified memory architectures that span CPU and GPU. To stay ahead, prioritize modular power supplies, robust cooling solutions, and motherboards that support the latest PCIe and BIOS features. Keep a habit of quarterly driver clean‑installs and firmware checks; this proactive maintenance will keep your system stable as software demands evolve. Lastly, consider building a small test rig—perhaps an older GPU paired with a spare motherboard—to trial new driver releases before deploying them on your primary workstation. This sandbox approach reduces downtime and ensures that when a new AI‑driven application hits the market, you’re ready to run it without a hitch.
Wrapping Up: A Troubleshooter’s Mindset
At its core, GPU troubleshooting is about curiosity, patience, and a systematic approach. In 2026, the complexity of graphics hardware can be intimidating, but it also offers a rewarding puzzle for anyone willing to dig deep. By starting with the software stack, validating power and thermal health, leveraging advanced diagnostics, and tapping into community knowledge, you can resolve the majority of issues without resorting to costly replacements. Keep your tools updated, document every step, and never underestimate the power of a fresh driver install. Your GPU is an investment that fuels creativity and innovation—treat it with the same care you would a high‑performance instrument, and it will reward you with years of flawless performance.