When you’ve spent countless hours fine‑tuning a build for latency‑critical workloads, the last thing you want is a rogue memory module turning your pristine setup into a jittery nightmare. In 2026, RAM has evolved beyond the familiar DDR5 sticks of the early 2020s, with DDR6‑E and early DDR7 modules promising higher bandwidth and tighter timings. Yet the core challenge remains: a single faulty cell or a mis‑configured timing can cripple even the most robust platform. As a power user, you know that memory is the nervous system of your PC—if it’s not firing correctly, the whole body feels the pain. This guide walks you through the modern troubleshooting workflow, blending classic techniques with the AI‑assisted diagnostics that have become standard in today’s operating systems. By the end, you’ll have a repeatable process that lets you pinpoint, isolate, and resolve RAM‑related issues before they cascade into data loss or those dreaded blue screens.
Spotting the Tell‑Tale Signs of Bad RAM
Random reboots, spontaneous application crashes, and the infamous “Memory Management” stop code are the hallmarks of problematic memory, but power users often notice subtler cues first. In high‑performance scenarios—like real‑time rendering or large‑scale simulations—you might see frame‑rate spikes that don’t correlate with GPU load, or latency spikes in network‑intensive tasks that defy bandwidth calculations. These symptoms arise because the CPU is repeatedly requesting data that either isn’t there or is corrupted on the fly, forcing it to stall or abort processes. Even a seemingly innocuous “program not responding” dialog can be the symptom of a single bad DIMM that’s intermittently failing under thermal stress. Understanding these patterns helps you differentiate between a software memory leak and a hardware fault, saving you hours of blind debugging.
Tools of the Trade: From Built‑In Utilities to AI‑Powered Test Suites
The first line of defense in 2026 is still the classic Windows Memory Diagnostic, but it now leverages AI‑driven heuristics to prioritize test patterns that expose timing‑related failures. For deeper analysis, bootable MemTest86+ remains the gold standard, offering extensive stress cycles that push modules to their voltage and frequency limits. Many motherboards now embed a quick‑test routine directly in the UEFI, letting you run a ten‑minute sanity check without leaving the firmware. If you encounter a blue screen during these tests, cross‑reference the stop code with our blue screen prevention guide to quickly isolate whether the fault is memory‑related or tied to a driver issue. Additionally, third‑party suites like PassMark MemTest and the emerging AI‑assisted RAM health monitor in major OS kernels can flag marginal errors before they become catastrophic.
Physical Inspection: The Hands‑On Approach No Software Can Replace
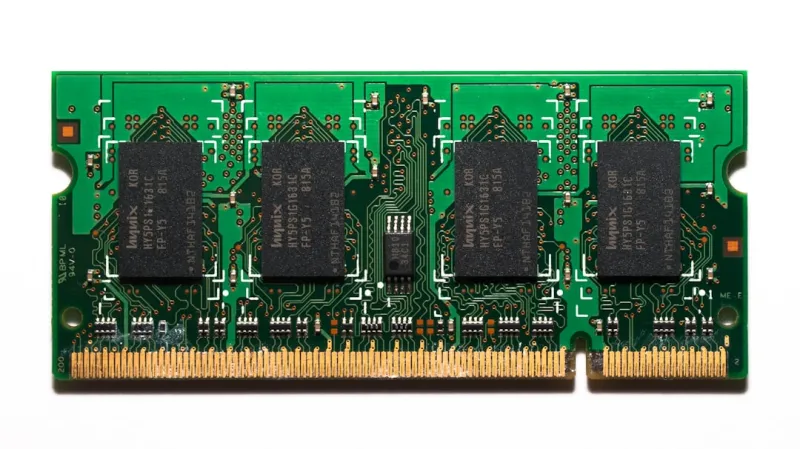
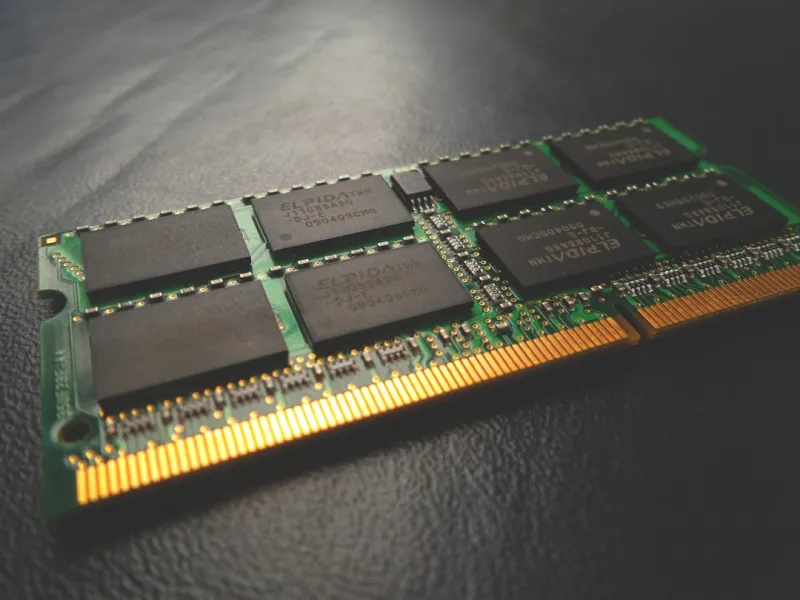
Even with sophisticated diagnostics, a tactile inspection often saves the day. Power down, unplug, and ground yourself before you remove the DIMMs. Look for dust or debris on the contacts—tiny particles can interrupt signal integrity, especially at the high frequencies DDR6‑E operates at (up to 6400 MT/s). Verify that each stick is fully seated; a loose module can cause intermittent failures that mimic a bad chip. When mixing capacities or speeds, ensure all sticks share the same voltage requirements; mismatched timings can force the memory controller into a fallback mode, degrading performance and stability. If you notice any physical damage—scratches, cracked heat spreaders, or warped contacts—replace the module immediately. A clean, well‑mounted RAM configuration is the foundation upon which all subsequent tuning rests.
BIOS/UEFI Settings: Tuning Timings, Voltages, and Profiles
The modern UEFI gives you granular control over every timing parameter, and mastering these knobs is essential for a rock‑solid system. Start by enabling the XMP (Extreme Memory Profile) that matches your RAM’s rated speed; this automatically sets the correct frequency, voltage, and timings. If you still experience instability, manually raise the DRAM voltage in small increments (typically 0.05 V) while monitoring temperatures. Tightening CAS latency or other primary timings can boost performance, but each tweak should be validated with a full MemTest86+ run. Remember that many CPUs in 2026 now feature integrated ECC support for non‑ECC DIMMs, which can silently correct single‑bit errors—enabling this feature in the BIOS can add an extra safety net, though it may slightly impact latency. For those seeking the ultimate overclock, consult the future‑ready hardware guide to understand how your motherboard’s power delivery and cooling solutions influence memory stability.
Compatibility Checks: Motherboard QVLs and CPU Memory Controllers
Even the most meticulous builder can fall prey to incompatibility pitfalls. Every motherboard publishes a Qualified Vendor List (QVL) that enumerates tested RAM kits; while you’re not strictly limited to those, straying far outside the list increases risk. Cross‑reference your CPU’s memory controller specifications—AMD’s Zen 4 and Intel’s Meteor Lake architectures support different maximum speeds and capacities, and pushing beyond those limits often leads to subtle errors that only manifest under load. When planning a multi‑channel configuration, ensure you’re populating the correct slots to enable dual‑ or quad‑channel operation, as misplacement can force the system into single‑channel mode, dramatically reducing bandwidth. If you’re unsure, the operating‑systems in 2026 article provides a deep dive on how AI‑driven kernels can adapt to memory configurations, but it still relies on a solid hardware baseline.
Advanced Diagnostics: Slot‑Swapping, Module Isolation, and Firmware Updates
When basic tests point to a fault but don’t reveal the culprit, it’s time for systematic isolation. Start by testing one stick at a time in the primary slot, running a complete MemTest86+ cycle on each. If a module passes, move it to the next slot and repeat; this method isolates both defective DIMMs and faulty DIMM slots. Firmware updates for both the motherboard BIOS and the memory modules themselves have become more common, as manufacturers release microcode patches to improve signal integrity at higher speeds. Always back up your current BIOS configuration before flashing, and consider using the “dual‑boot safe mode” offered by many UEFI interfaces to revert if something goes wrong. Document each configuration change in a simple spreadsheet—tracking voltage, timings, and test results—to build a knowledge base that will streamline future upgrades.
Software‑Level Memory Leaks vs. Hardware Faults: The Modern Power‑User’s View
Not every “out‑of‑memory” alert stems from a bad DIMM; software leaks can exhaust RAM just as quickly. In 2026, AI‑assisted operating systems provide real‑time memory usage analytics, flagging processes that deviate from baseline consumption patterns. Use tools like Windows Resource Monitor or Linux’s perf‑top to identify runaway applications, then cross‑reference the timeline with any hardware test failures. If the system remains stable under synthetic memory stress but crashes during a specific workload, the issue is likely a leak rather than a physical fault. However, a faulty memory module can exacerbate leaks by corrupting allocation tables, so it’s wise to run a full memory diagnostic after fixing any software‑related problems. This dual‑pronged approach ensures you don’t waste hours chasing a ghost while the underlying hardware quietly fails.
Best‑Practice Checklist and Looking Ahead
To wrap up, here’s a concise checklist for RAM health: (1) Run an AI‑enhanced Windows Memory Diagnostic after every major driver update. (2) Perform a full MemTest86+ cycle quarterly, especially after overclocking. (3) Keep BIOS and firmware up to date, noting any changes to memory timing defaults. (4) Verify physical seating and cleanliness whenever you add or remove modules. (5) Document configuration changes, voltage tweaks, and test results. Looking forward, DDR7 and high‑bandwidth memory (HBM) solutions are on the horizon, promising terabytes per second of throughput—yet the fundamentals of stability will remain unchanged. By adopting a disciplined, data‑driven troubleshooting workflow today, you’ll be prepared to harness the next generation of memory technology without the fear of unexpected crashes. Stay vigilant, keep your logs clean, and let your system’s AI assistants do the heavy lifting while you focus on performance gains.