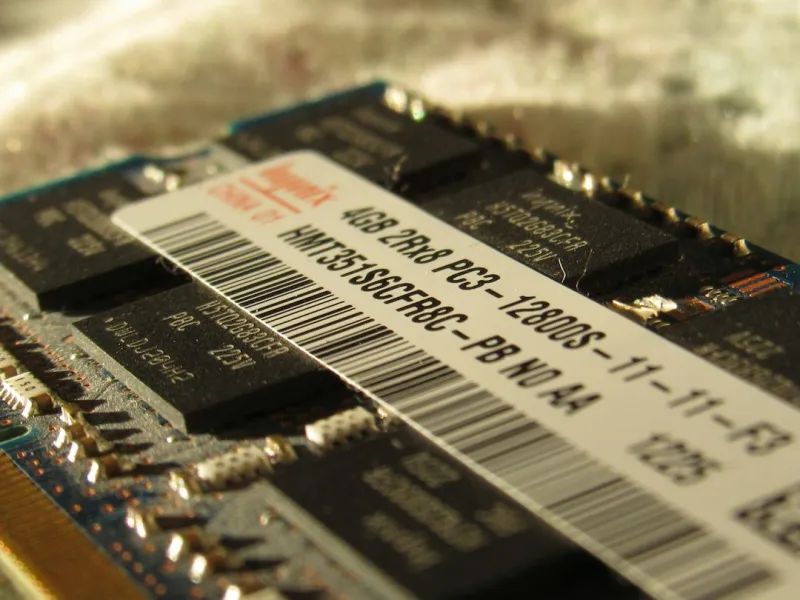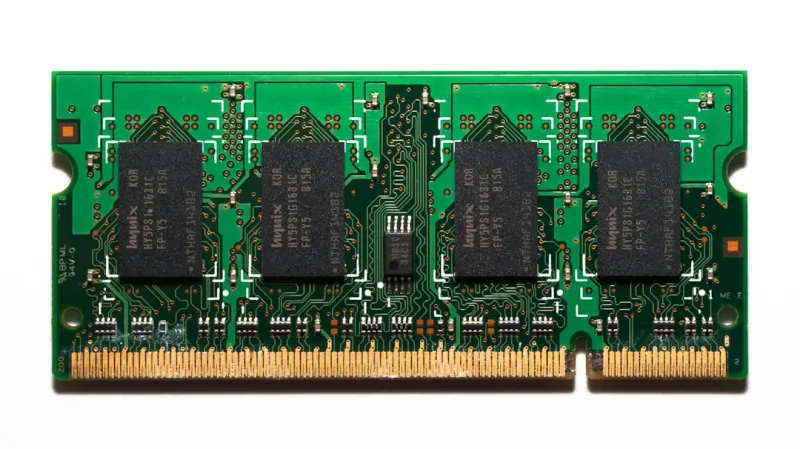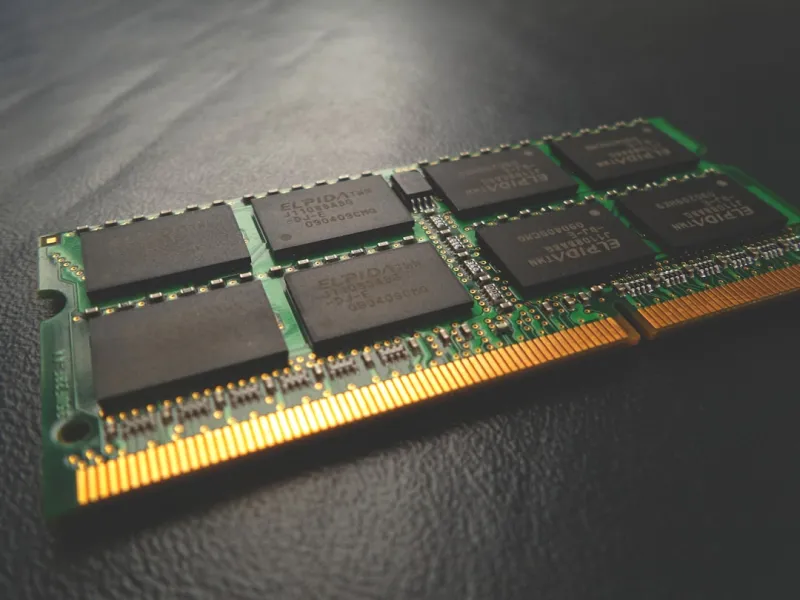
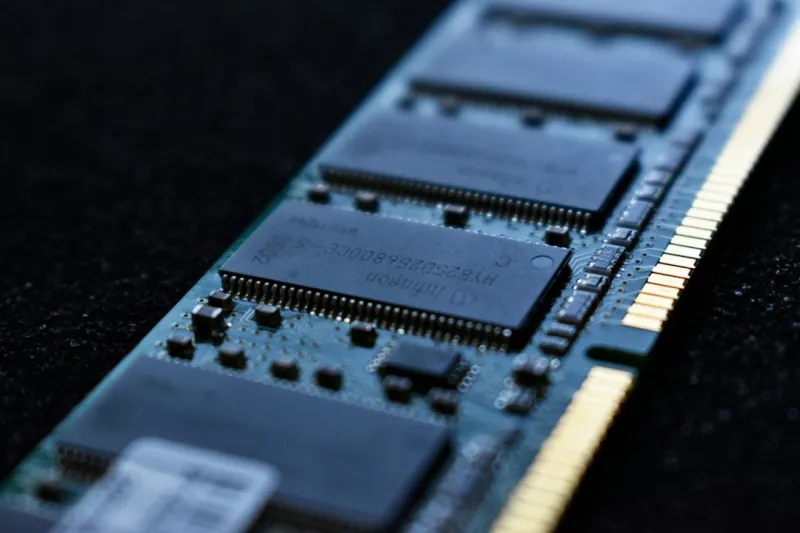
When I first started tearing apart my 2019 build, the memory modules were the quiet, invisible workhorse that never got the applause I gave my GPU. Fast forward to 2026, and RAM has evolved from a simple 8 GB stick to high‑capacity, low‑latency kits that can make or break the experience of a power user. In this deep‑dive, I’ll walk you through the mindset I use when RAM throws a tantrum—whether it’s random crashes, sluggish multitasking, or that dreaded “memory could not be read” error. We’ll cover the diagnostic toolbox I keep on my desk, the BIOS tweaks that can coax a shy module into full performance, and the tell‑tale signs that you’ve outgrown your current kit. By the end, you’ll have a step‑by‑step plan that feels less like a guessing game and more like a methodical, confidence‑building routine—exactly the way I’d want to troubleshoot my own rig.
Why RAM Issues Appear Out of Nowhere
Even the most meticulously built systems can develop memory headaches over time. Thermal cycles, dust, and even subtle voltage drifts can cause a module that was rock‑solid at day one to start misbehaving months later. I’ve seen perfectly matched DDR5 kits suddenly throw “memory parity errors” after a few weeks of heavy AI model training because the VRM was struggling to keep the voltage within spec. In other cases, a simple firmware update for the motherboard resets the SPD (Serial Presence Detect) values, causing the system to fall back to default timings that are too loose for the module’s rated speed. The result? Random freezes, blue screens, or applications that crash right after opening a large dataset. Understanding that RAM isn’t a static component but a dynamic participant in the power‑delivery and thermal ecosystem is the first step toward diagnosing the problem accurately.
Step 1: Run Built‑In Diagnostics Before Anything Else
Before you dive into hardware swaps, fire up the native tools that Windows and macOS already provide. In Windows 10/11, the Memory Diagnostic tool (type “mdsched” in the Run dialog) will reboot your machine and run a quick “Standard” test; for a deeper scan, select the “Extended” option which can take an hour or more but will flag subtle errors that a standard pass might miss. macOS users can hold the D key during startup to launch Apple Diagnostics, which also checks RAM among other components. In my experience, these tools are surprisingly effective at catching ECC‑like issues on non‑ECC consumer boards that manifest as intermittent freezes. If the test reports a failure, you’ve already isolated the RAM as the culprit without opening the case. But if the diagnostics pass, it’s time to move on to more aggressive, third‑party testing.
Step 2: Deploy MemTest86 for a Comprehensive Sweep
MemTest86 remains the gold standard for memory validation. Download the latest ISO (2026 version includes UEFI support for the newest platforms) and create a bootable USB. Once you boot, let the test run at least three full passes—each pass cycles through a different algorithm that stresses the module’s rows, columns, and address lines. I always watch for “Pattern mismatch” errors; a single error can indicate a defective chip, a bad solder joint, or a timing conflict. If you have multiple sticks, test them one at a time to pinpoint the faulty module. Remember to run the test in the same RAM profile you use daily—if you’ve over‑clocked, keep those settings active in the BIOS. The time investment pays off: catching a bad stick early saves hours of troubleshooting later, especially when you’re juggling AI workloads that demand stable, high‑throughput memory.
Step 3: Verify BIOS Settings and SPD Profiles
Modern motherboards auto‑detect RAM speed, timings, and voltage, but the auto‑profile isn’t always optimal. In my own rigs, I often find that the BIOS defaults to a conservative JEDEC profile, leaving performance on the table. Open the BIOS, navigate to the “Advanced Memory Settings,” and compare the current values against the module’s XMP (or EXPO for AMD) profile. Enable XMP and ensure the voltage matches the manufacturer’s spec—usually 1.35 V for DDR4, 1.25 V for many DDR5 kits, but always double‑check. If you’re seeing crashes after enabling XMP, try a manual profile: tighten the timings a step at a time (e.g., CL from 16 to 15) while monitoring system stability. Also, look for “Memory Training” logs; a failed training step can indicate a slot issue or a module that isn’t communicating properly with the memory controller. Adjusting these settings can often cure mysterious crashes without any physical changes.
Step 4: Reseat, Clean, and Inspect Physically
Physical connection problems are surprisingly common, especially after moving a system or after a few years of vibration from daily use. Power down, unplug, and remove each stick; use a can of compressed air to clear dust from the DIMM slots and the contacts on the modules themselves. When reseating, apply even pressure on both ends until you hear the familiar click—this ensures the golden pins make full contact. While the case is open, inspect the motherboard for any signs of corrosion, burnt traces, or bulging capacitors near the memory slots; any of these can cause intermittent failures that look like RAM errors. I’ve rescued a system where a single loose screw was pressing against a DIMM slot, causing a short that manifested as random blue screens. A quick visual inspection can save you from needless part replacements.
Step 5: Stress Test the Whole System After Repairs
Once you’ve cleared errors and confirmed stable BIOS settings, it’s essential to validate the entire system under load. Tools like Prime95 (Blend test) and AIDA64’s “Memory Stress Test” push both the CPU and RAM simultaneously, mimicking real‑world workloads such as video rendering or AI model training. Run the stress test for at least an hour while monitoring temperatures and voltages with HWMonitor or the motherboard’s built‑in health dashboard. If you encounter a crash, note the exact moment—was it during the memory-intensive portion or when the CPU hit a thermal limit? This data helps you decide whether the issue was truly RAM‑related or if another component, like an over‑taxed VRM, is the actual bottleneck. In my practice, a clean stress test run is the final seal of approval before I declare the machine “good to go.”
When to Consider an Upgrade Path
Even after exhausting diagnostics, you might discover that your current RAM simply can’t keep up with the demands of modern workloads—especially as AI and real‑time ray tracing become mainstream. In that case, a strategic upgrade is the smartest move. I often reference Unlock Next‑Level Performance: The Upgrade Path Every PC Enthusiast Should Follow for a roadmap that balances capacity, speed, and latency. Aim for at least 32 GB of DDR5 for heavy multitasking, and consider a kit with a tighter CAS latency (e.g., CL 30 vs. CL 34) if you’re chasing the lowest possible frame times. Remember that mixing speeds can degrade performance, so stick to a single kit whenever possible. Also, keep an eye on the motherboard’s QVL (Qualified Vendor List) to ensure the new modules are officially supported—this reduces the chance of compatibility quirks that can masquerade as “bad RAM.”
Preventive Habits to Keep RAM Happy for Years
Finally, the best troubleshooting is prevention. Keep your system dust‑free; a clean chassis maintains lower temperatures, which in turn preserves the integrity of the memory chips. Schedule quarterly re‑applications of thermal paste on your CPU and ensure the VRM heatsinks are not clogged—stable voltage delivery is crucial for RAM longevity. Enable automatic BIOS updates if your manufacturer offers a reliable channel; firmware patches often resolve subtle timing bugs that only surface under extreme loads. For Windows power users, I recommend reading Critical PC Updates Every Power User Must Know to stay on top of driver and firmware releases that affect memory performance. Lastly, adopt a habit of running a quick MemTest86 pass after any major hardware change. By integrating these small practices into your routine, you’ll extend the life of your RAM and reduce the frequency of those frustrating crashes that interrupt your workflow.