Why Every Power‑User Needs a Systematic Video‑Card Playbook
When my RTX 4090 started spewing green squares during a simple 4K YouTube binge, I knew it was time to pull out the toolbox of diagnostics that I’ve honed over a decade of high‑performance builds. In 2026, graphics hardware is more sophisticated than ever, yet the failure modes remain surprisingly classic: driver mismatches, power delivery hiccups, thermal throttling, and firmware bugs. The key difference today is the sheer volume of firmware layers—BIOS, VBIOS, and the OS driver stack—all of which can conflict if you’re not vigilant. My approach is to treat each symptom as a clue in a larger mystery, applying a repeatable methodology that any power‑user can adopt. By the end of this guide you’ll have a checklist that turns a flickering screen into a clear path forward, whether you’re juggling AI‑accelerated workloads or pure gaming performance. Think of this as the “detective’s notebook” for your GPU, a living document you’ll reference whenever your card decides to act up.
Mapping Symptoms to Root Causes
The first step in any troubleshooting saga is to map what you see to what’s likely going wrong. Visual artifacts—those dreaded sparkles, tearing, or color banding—often point to memory errors or overheating, while sudden driver crashes and BSODs usually scream mismatched driver versions or corrupted system files. Audio dropouts during video playback can be a sign of PCIe bandwidth saturation, especially on newer motherboards that split lanes between M.2 storage and the GPU. In my own experience, a sudden loss of signal on the display port was traced back to a loose power connector, a reminder that even the most robust builds can suffer from simple mechanical oversights. By categorizing symptoms into visual, stability, and performance buckets, you can prioritize which diagnostic tool to run first, saving hours of guesswork. Documenting each occurrence—time, temperature, workload—creates a pattern that often reveals the underlying issue before you even open the case.
Driver Dilemmas and the Windows 12 Edge
In the era of Windows 12, driver management has taken on a new dimension. The OS now offers a “Dynamic Driver Stream” that auto‑updates graphics drivers in the background, which is great for security but terrible when you need a stable baseline for benchmarking. My go‑to strategy is to roll back to the NVIDIA or AMD WHQL driver that shipped with the card’s launch, then use Why Your Video Card Is Acting Up and How to Fix It Fast as a reference point for clean installs. I always run DDU (Display Driver Uninstaller) in safe mode to strip every remnant of the previous driver, then reinstall the selected version manually. This eliminates hidden conflicts that the Windows driver store can introduce. Additionally, checking the “Graphics Settings” panel in Windows 12 for any per‑app overrides can prevent low‑level API mismatches that manifest as stuttering in specific titles.
Power Delivery, BIOS Tweaks, and the Hidden Limits
Modern GPUs draw power not just from the 8‑pin connectors but also from the motherboard’s PCIe slot, meaning that a weak VRM or an undervolted BIOS can cripple performance before you even notice a temperature rise. I always start by confirming that the PSU meets the card’s wattage recommendation—ideally with a 20% headroom for overclocking spikes. Next, I dive into the BIOS, enabling “Above 4G Decoding” and setting the PCIe link speed to the maximum supported (usually Gen 5 in 2026). For enthusiasts, the “Power Limit” slider in the GPU’s control panel can be nudged upward by 5–10% to unlock hidden headroom, but only after verifying stable power delivery with a digital multimeter. A quick test is to run a short stress loop and watch the power draw; if you see the PSU’s voltage dip below 11.8 V, you’ve found your bottleneck. These low‑level adjustments often solve issues that look like driver bugs on the surface.
Thermal Management: The Unsung Hero of Stability
Even the most robust cooling solutions can fall victim to dust, degraded thermal paste, or improper fan curves. In my rig, I schedule a quarterly “thermal audit”: I remove the GPU shroud, blow out dust with a can of compressed air, and reapply a high‑performance thermal paste like Thermal Grizzly Kryonaut. I then use the built‑in fan curve editor to create a more aggressive ramp‑up, targeting 70 °C under load instead of the default 80 °C. Monitoring tools such as HWInfo64 or MSI Afterburner provide real‑time temperature graphs, which I overlay on stress‑test logs to spot any spikes. If the GPU consistently hits 85 °C during AI inference tasks, it may be time to consider a hybrid water block or upgrade to a case with better airflow. Remember, thermal throttling doesn’t just reduce performance; it can corrupt GPU memory, leading to the visual artifacts discussed earlier.
Benchmarking and Stress‑Testing: Turning Data into Action
Once you’ve addressed drivers, power, and thermals, the next step is to validate the fixes with repeatable benchmarks. I favor a trio of tools: 3DMark Time Spy for synthetic gaming performance, Unigine Heaven for visual stress, and Blender’s Render Benchmark for compute‑heavy workloads. Running each test three times and recording the average FPS, frame times, and temperature gives you a baseline to compare against future changes. If you notice a deviation greater than 5% from the expected score, it’s a red flag that something else is amiss—perhaps a subtle BIOS bug or a hidden power‑limit throttle. Logging the results in a spreadsheet with timestamps and driver versions creates a historical record that makes pattern‑recognition effortless. In my own builds, this data-driven approach saved me from a costly RMA by pinpointing a firmware bug that was fixed in a later VBIOS update.
When to RMA: Recognizing the Point of No Return
Even the most diligent troubleshooting can hit a wall, especially when the fault lies within the silicon itself. After exhausting driver rolls, power checks, thermal clean‑ups, and firmware updates, if you still encounter random crashes or persistent artifacting under minimal load, it’s time to consider an RMA. Most manufacturers require you to capture a crash dump and a detailed log of your testing steps; having the benchmark spreadsheet and temperature logs handy can accelerate the approval process. Keep your original packaging and receipts—some warranties in 2026 have a 3‑year term, but only if you can prove the card was handled responsibly. When filing the RMA, reference the specific VBIOS version you’re on and any known issues documented on the vendor’s support forums. A well‑documented case often results in a quicker replacement, sparing you weeks of downtime.
Future‑Proofing Your GPU Choice in a Rapidly Evolving Landscape
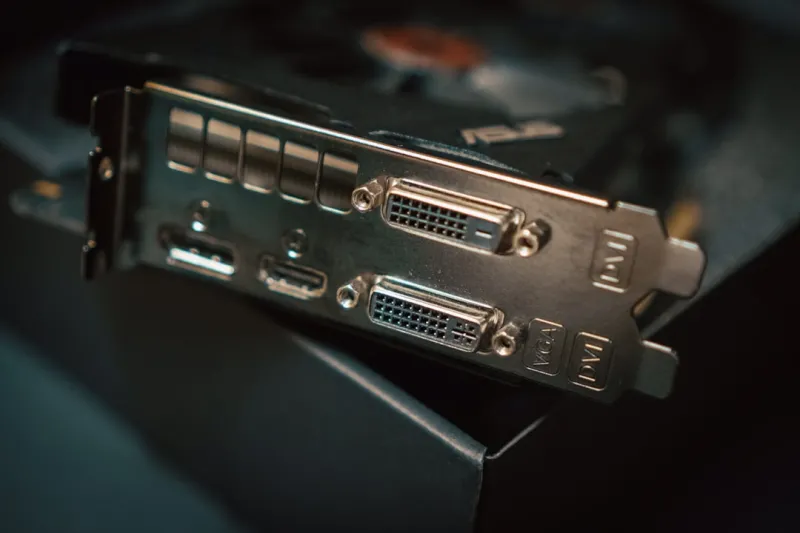
Looking ahead, the GPU market in 2026 is being shaped by AI acceleration, real‑time ray tracing, and the rollout of PCIe 5.0 x16 lanes. When selecting a new card, prioritize models with a robust VRM design, ample HDMI 2.1 and DisplayPort 2.1 outputs, and a VBIOS that receives regular updates. If you anticipate heavy AI workloads, consider GPUs that expose dedicated tensor cores and include driver support for frameworks like TensorFlow and PyTorch. Pairing your GPU with a motherboard that offers a dedicated “GPU Power” header can also mitigate power‑delivery issues down the line. For a broader perspective on building a resilient system, check out Building a Future‑Proof PC in 2026: The Power‑User’s Blueprint, which walks through component synergy and upgrade pathways. By treating your graphics card as a core element of a modular, upgrade‑friendly ecosystem, you’ll avoid many of the headaches that force emergency troubleshooting in the first place.
Wrapping Up: Your Ongoing GPU Detective Journal
The journey from a flickering screen to a fully stable rig is rarely a straight line; it’s a series of hypotheses, tests, and refinements. The most valuable tool in your arsenal is a habit of meticulous documentation—notes, screenshots, and logs that capture every change you make. When you combine that discipline with the systematic approach outlined above, you’ll find that even the most stubborn GPU issues unravel quickly. And if you ever feel stuck, remember that the broader power‑user community is a click away: resources like Unlock the Full Potential of Windows 12 for Power Users can provide fresh insights into OS‑level interactions. Stay curious, stay methodical, and let your GPU run at its full potential—no more mystery artifacts, just pure performance.