
When I first started swapping out memory sticks on my own rigs back in the early days of the AI‑enhanced desktop, I quickly learned that RAM isn’t just a silent workhorse—it’s the pulse that keeps every thread of your workflow alive. In 2026, with AI copilot assistants demanding ever‑larger context windows and real‑time rendering pipelines pushing terabytes per second, a single faulty chip can bring a power‑user’s day to an abrupt halt. That’s why I treat memory troubleshooting as a ritual, not an after‑thought. I’ll walk you through the tell‑tale signs, the diagnostic tools that actually work, and the proactive steps you can take to keep your system humming even as software expectations skyrocket. Whether you’re a developer building the next quantum‑ready stack or a content creator juggling 8K timelines, the principles below will help you identify, isolate, and resolve RAM woes before they snowball into costly downtime.
Spotting the Symptoms Before They Snowball
The first clue that your RAM is on the fritz often masquerades as a software glitch. Random application crashes, unexplained blue screens, and stubborn “out of memory” alerts—especially on machines that should have ample headroom—are classic red flags. In my experience, the most deceptive symptom is intermittent performance throttling: one moment you’re slicing through a massive 3‑D scene, the next you’re stuck waiting for a simple spreadsheet formula to compute. If you notice that your system freezes during memory‑intensive tasks like training a diffusion model or compiling a massive codebase, it’s time to suspect a memory issue. Even subtle cues like delayed keyboard response after a heavy multitask session can indicate that a DIMM is failing to keep up with the memory controller’s demands. Keep a log of when crashes occur and what applications were running; patterns will emerge that point directly to the memory subsystem rather than the software layer.
Running the Right Diagnostic Suite
Windows’ built‑in Memory Diagnostic is a good starter, but for a power‑user who refuses to settle for “maybe,” I always recommend a deep dive with MemTest86 or the open‑source Prime95 blend test. Boot from a USB stick, let the tests run for at least four passes—each pass can take an hour or more on a modern DDR5 kit. I’ve caught elusive timing errors that only surface under sustained stress, something the quick Windows check simply glosses over. For those who prefer a GUI, the Why Memory Issues Crash Even the Best PCs—and How to Fix Them guide outlines a step‑by‑step visual workflow using the Windows Performance Analyzer to correlate memory errors with CPU throttling events. Remember to run diagnostics on a clean boot environment to eliminate background services that could mask true RAM behavior. Once you’ve isolated the faulty module, the next step is to verify whether the issue lies in the DIMM itself or the motherboard’s memory controller.
Common Culprits: From Mismatched Timings to BIOS Glitches
Even with premium DDR5 kits, mismatched timings or incorrect voltage settings can wreak havoc. I’ve seen users pair a 5600 MT/s module with a 5400 MT/s stick, assuming the system will simply run at the lower speed. In reality, the memory controller may attempt to negotiate a hybrid profile, leading to instability under load. Another frequent offender is outdated BIOS firmware that doesn’t fully support the latest memory profiles—especially on motherboards that shipped before the 2025 DDR5 standard revisions. In such cases, the system may default to conservative timings that, while stable at boot, fail when the CPU requests rapid burst transfers. Lastly, physical issues like poor contact due to dust or a bent CPU socket can cause intermittent errors that only appear during heavy memory traffic. A quick visual inspection, combined with reseating the modules and cleaning the slots with compressed air, often resolves these seemingly mysterious glitches.
Hands‑On Fixes: Reseat, Refresh, Replace
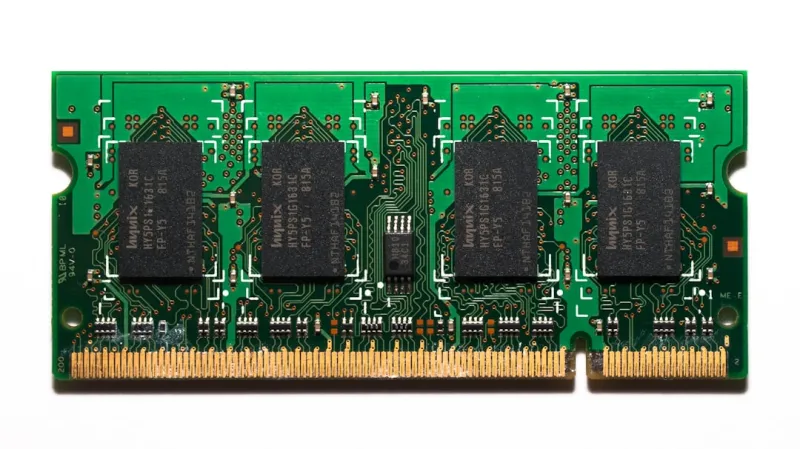
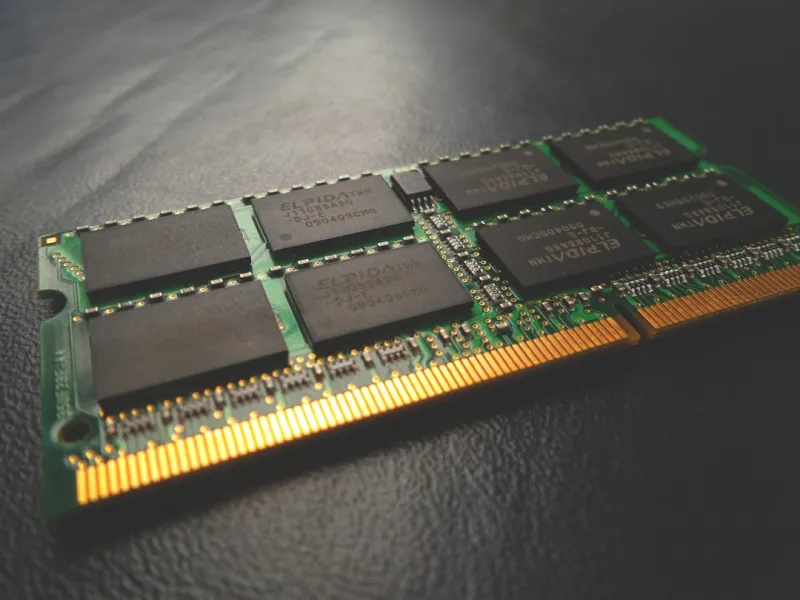
After you’ve identified a suspect module, the first line of defense is the good‑old reseat. Power down, unplug, and gently remove each DIMM, then reinstall them ensuring they click firmly into the motherboard’s notches. I always recommend alternating slots when reinstalling to test for slot‑specific faults—sometimes a single lane on the memory bus is damaged. If reseating doesn’t clear the errors, update your BIOS to the latest version; manufacturers routinely release micro‑code patches that improve memory compatibility, especially for new high‑density chips. Should the problem persist, it’s time to replace the module. When selecting a replacement, stick to kits that are listed on the motherboard’s QVL (Qualified Vendor List) and enable XMP profiles that match your target speed and latency. For those building a future‑proof rig, I often reference the Designing a Future‑Ready Power‑User PC in 2026 article for guidance on choosing memory that will remain stable through multiple CPU generations.
Preventive Practices for the Savvy Power‑User
Prevention is far cheaper than remediation, especially when your workstation powers revenue‑critical workloads. Start by configuring your BIOS to run memory at the manufacturer‑specified voltage and timings, rather than relying on the “auto” settings that can drift over time. Enable ECC (Error‑Correcting Code) if your platform supports it; while not necessary for every consumer board, ECC can catch single‑bit errors before they cascade into crashes—a feature I’ve found invaluable when training large language models that run for days non‑stop. Additionally, monitor your system’s temperature and power delivery using tools like HWInfo or the built‑in Windows Resource Monitor. Overheating DRAM can cause timing drift, so ensure adequate airflow and consider adding a dedicated RAM heatsink if you’re pushing 5600 MT/s kits. Finally, schedule regular memory health checks—run a quick MemTest86 pass each month—to catch degradation early. These habits not only extend the life of your current hardware but also make future upgrades smoother, as you’ll already have a baseline of what “healthy” looks like on your platform.
Advanced Strategies: ECC, Memory Profiling, and When to Go Beyond
For those of us who run mission‑critical services on bare metal, the decision between consumer DDR5 and workstation‑grade ECC memory can be a game‑changer. ECC adds a slight latency overhead, but the peace of mind it offers—automatically correcting single‑bit errors and flagging multi‑bit failures—often outweighs the performance cost. In my own setup, I’ve integrated Intel’s Optane Memory as a cache layer to offload random read‑writes, thereby reducing pressure on the primary RAM during heavy I/O bursts. To fine‑tune this balance, I rely on memory profiling tools that map usage patterns across cores, letting me identify bottlenecks where latency spikes. The article Why RAM Problems Slip Past Power Users and How to Fix Them dives deeper into these profiling techniques, showing how a simple adjustment to NUMA node affinity can eliminate subtle stalls that most users never notice. When you combine ECC, precise profiling, and a well‑balanced cache hierarchy, you essentially build a memory subsystem that can tolerate the unpredictable demands of 2026’s AI‑first workloads.
Wrapping Up: Continuous Monitoring and the Power‑User Mindset
Memory issues don’t have to be a mystery you solve once and forget. In my workflow, I keep an eye on RAM health through a combination of real‑time alerts and periodic deep scans. Set up Windows Event Viewer to flag “Memory Management” warnings, and pair that with a scheduled task that launches MemTest86 in the background during off‑hours. When you notice a trend—like a gradual increase in corrected ECC errors or a spike in page‑file usage—treat it as an early warning sign rather than a one‑off glitch. The ultimate goal is to cultivate a proactive mindset: anticipate the next software generation’s memory appetite and align your hardware upgrades accordingly. By staying disciplined with diagnostics, adhering to best‑practice configurations, and leveraging the advanced resources linked throughout this post, you’ll keep your power‑user rig resilient, responsive, and ready for whatever the next wave of AI‑driven applications throws at it.