When I first ripped open a mid‑range RTX card back in the early days of ray tracing, I never imagined the troubleshooting landscape would evolve into the intricate maze it is today. In 2026, video cards aren’t just about raw horsepower; they’re the nexus of AI acceleration, real‑time rendering, and even crypto‑grade compute workloads. This convergence means that a single symptom—say, flickering textures—might stem from anything ranging from a stray BIOS setting to a mismatched driver stack designed for deep‑learning inference. Over the years I’ve learned to treat every glitch as a story, not a symptom, and to let the hardware whisper its secrets before I jump to conclusions. In this post, I’ll walk you through the diagnostic mindset I use, the tools that have become indispensable, and the step‑by‑step fixes that have saved countless builds from a premature death. Think of it as a field guide for anyone who’s ever stared at a black screen, wondering whether it’s the GPU’s fault or something far more subtle lurking beneath the surface.
Start with the Basics: Power, Temperature, and Physical Connections
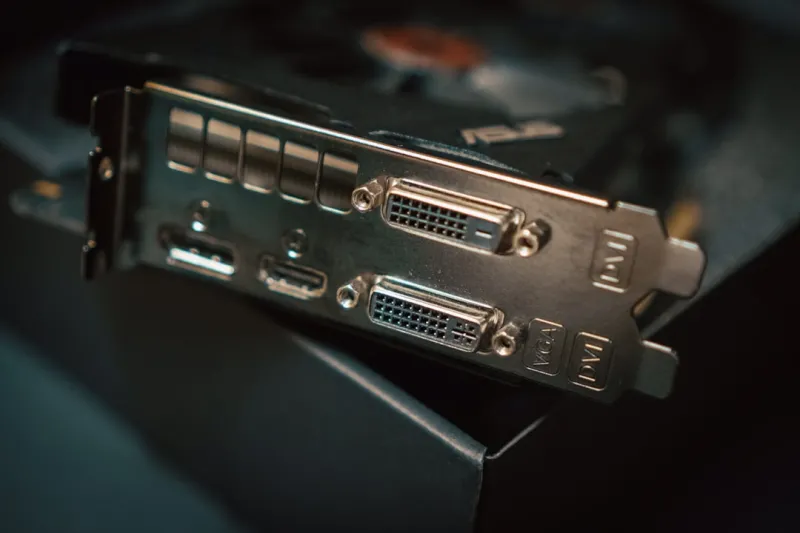
The first three minutes of any GPU troubleshooting session should feel like a quick health check—no fancy software needed. Verify that your power supply is delivering stable voltages; a sudden dip can cause the card to throttle or shut down entirely. Use a reliable multimeter or a PSU tester to confirm the 12 V rail is within tolerance. Next, check temperatures with a hardware monitor like HWInfo; modern cards can safely run up to 85 °C, but sustained peaks above 90 °C often trigger thermal throttling, which manifests as frame drops or stuttering. Finally, inspect the PCIe slot and power connectors for dust, bent pins, or loose seating. A single misaligned 8‑pin connector can cause intermittent power loss, leading to the dreaded “GPU not detected” error. When I first faced a mysterious reboot loop, a simple reseat of the card and a fresh cleaning of the slot resolved the issue in under ten minutes. These foundational steps save time and prevent you from chasing phantom software bugs.
Driver Hell and the Art of Clean Installs
Driver conflicts remain the most common source of GPU misbehavior, even as Windows and Linux distributions become more driver‑aware. In 2026, manufacturers push updates weekly to fine‑tune AI tensor cores and ray‑tracing pipelines, but the rapid cadence can also introduce regressions. My go‑to strategy is a three‑step clean install: first, uninstall all existing GPU drivers using a utility like DDU (Display Driver Uninstaller) in safe mode; this wipes lingering registry entries that often cause “driver version mismatch” errors. Second, download the latest WHQL‑certified driver directly from the vendor’s site—avoid third‑party mirrors that might bundle outdated components. Third, perform a fresh installation, opting for the “custom” install and selecting a clean install checkbox if available. If you’re still seeing artifacts after a clean install, consider rolling back to the previous stable branch; the newest driver isn’t always the best for every configuration. For deeper diagnostics, the Unlocking the Secrets of Video Card Troubleshooting: A 2026 Guide offers a comprehensive checklist that aligns perfectly with this workflow.
Diagnosing Hardware Faults with Stress Tests and Logs
Once software variables are ruled out, it’s time to put the GPU under load to expose latent hardware issues. Tools like FurMark, 3DMark, and the newer AI‑focused benchmarks stress both the graphics pipeline and the power delivery network. Watch for sudden crashes, driver resets, or “GPU has stopped responding” messages. Simultaneously, keep an eye on the Windows Event Viewer or Linux dmesg logs; error codes such as “NVCRITICAL” or “AMD GPU hang” can pinpoint whether the fault lies in the silicon, the VRAM, or the driver stack. If the card fails a stress test at low temperatures, suspect VRAM defects or a failing capacitor on the PCB. In my experience, a subtle “white screen” that appears after exactly 12 minutes of continuous rendering often traced back to a faulty electrolytic capacitor, a problem that only shows up under sustained power draw. Documenting the test conditions and log timestamps helps when you need to RMA the card or discuss the issue with manufacturer support.
Memory Bottlenecks: When VRAM Becomes the Villain
VRAM capacity isn’t just a number on a spec sheet; it determines how comfortably a game or application can hold textures, shaders, and compute buffers. In 2026, many AAA titles and AI workloads demand 16 GB or more, and hitting that ceiling triggers page‑out to system RAM, causing severe frame‑time spikes. Use monitoring tools to watch VRAM usage in real time; if you see it consistently maxed out, consider lowering texture quality or disabling unnecessary post‑processing effects. However, if the usage spikes suddenly during a specific scene, it could indicate a memory leak in the driver or the application itself. A quick test is to run the game at a lower resolution with the same settings; if the problem disappears, the VRAM bandwidth is the bottleneck. For a deeper dive into memory‑related crashes, check out the guide on How to Diagnose and Fix RAM Issues Before They Crash Your PC, which also covers how system RAM interactions can exacerbate VRAM constraints.
Power Delivery and the Subtle Art of Voltage Tweaking
Modern GPUs feature dynamic voltage and frequency scaling (DVFS) to balance performance and power draw. While this is great for efficiency, it can also mask underlying power delivery problems. If you notice the card idling at a lower clock than expected or struggling to maintain boost frequencies under load, explore the GPU’s voltage curve using utilities like MSI Afterburner or the vendor’s own tuning software. Slightly raising the voltage offset can stabilize boost behavior, but do so incrementally and watch temperatures closely. In my own builds, a modest +0.025 V offset eliminated random stutter in a demanding simulation without pushing thermal limits. Conversely, if you’re seeing sudden power‑loss warnings, double‑check that your PSU has enough headroom; a 750 W unit that was once sufficient may now be strained by newer GPUs that draw 300 W under peak AI workloads. Ensuring the PSU’s 80 PLUS Gold rating and checking for clean, firm connector seating can prevent many power‑related headaches.
Software Interference: Overlays, Recorders, and Background Services
It’s easy to overlook the impact of third‑party software on GPU stability. Overlay tools (Discord, Steam), recording suites (OBS, Nvidia ShadowPlay), and even web browsers with WebGPU acceleration can compete for GPU resources, leading to driver resets or visual artifacts. A systematic approach is to perform a clean boot—disable all non‑essential startup services—and then reintroduce each application one by one while monitoring stability. I once spent hours chasing a “black screen” after a game launch, only to discover that an outdated version of a screen‑recording plugin was injecting a conflicting DirectX hook. Updating the plugin resolved the issue instantly. Moreover, keep an eye on Windows Game Mode; while it can boost performance, it sometimes disables background processes that the GPU relies on for telemetry, causing unexpected crashes. Maintaining an up‑to‑date ecosystem of utilities ensures the GPU can focus on delivering frames, not fighting software wars.
When All Else Fails: RMA Strategies and Communicating with Support
Even after exhaustive testing, a defective GPU can slip through. Preparing a solid RMA case saves both you and the manufacturer time. Compile a dossier that includes: a timeline of symptoms, logs from stress tests, screenshots of error messages, and a record of driver versions tried. Mention any troubleshooting steps already taken, such as clean driver installs, power checks, and BIOS updates. In my recent exchange with a leading GPU vendor, attaching a concise PDF with these details led to a fast‑track replacement within ten business days. Be explicit about the failure mode—whether it’s a “random driver reset after 30 minutes of AI inference” or “persistent artifacting at 4K resolution.” Clear, data‑driven communication shows you’ve done your homework and reduces the back‑and‑forth that often delays the RMA process. Remember, a well‑documented case not only gets you a quicker fix but also contributes to better future firmware releases.
Future‑Proofing Your Build: Lessons Learned and Proactive Measures
Looking ahead, the best defense against GPU headaches is proactive design. Choose a PSU with at least 20 % more capacity than your card’s rated power draw, and opt for motherboards that support the latest PCIe 5.0 or 6.0 specifications, ensuring ample bandwidth for next‑gen GPUs. Keep firmware and BIOS updated, not just for the GPU but for the entire platform; many issues stem from mismatched PCIe generations or outdated system firmware. Finally, schedule regular maintenance—clean dust filters, reapply thermal paste every 2–3 years, and run periodic stress tests to catch degradation early. By treating your GPU as a living component that ages and evolves, you’ll enjoy smoother performance and fewer surprise failures. As we continue to push the envelope of real‑time ray tracing and AI‑accelerated workloads, this mindset will be your greatest asset in keeping your rig reliable and future‑ready.