
When I first started feeling the dreaded “system freeze” during a late‑night coding sprint, my mind raced straight to the GPU. After all, that’s the flashy component that most power‑users obsess over. But the culprit turned out to be something far less glamorous: a misbehaving stick of RAM. In 2026, memory modules have become more sophisticated, with higher frequencies, tighter timings, and on‑die error correction, yet they’re also more finicky. This article walks you through the systematic approach I’ve honed over years of troubleshooting, blending low‑level hardware checks with the software diagnostics we power users rely on daily. Whether you’re building a workstation for AI workloads, a render farm, or just trying to keep your development environment buttery‑smooth, mastering RAM troubleshooting can be the difference between a productive day and a frustrating reboot loop.
Understanding Modern RAM Basics
Before you can fix a problem, you need to know what you’re dealing with. DDR5 is the dominant standard in 2026, offering up to 6400 MT/s speeds and on‑chip ECC options for pros who can’t afford a single bit error. Latency is now expressed in CL (CAS latency) combined with the clock multiplier, so a CL‑36 module at 5600 MT/s behaves differently from a CL‑40 at 6400 MT/s, even if the raw bandwidth looks comparable. Dual‑channel and even quad‑channel configurations are common in high‑end workstations, meaning the memory controller expects matched pairs or sets. Mismatched capacities, ranks, or timings can cause the controller to fall back to the lowest common denominator, throttling performance and sometimes triggering stability issues. Knowing the specs of each stick—capacity, speed, voltage, and timing—gives you a solid baseline for troubleshooting.
Symptoms That Point Straight to Memory
RAM‑related problems masquerade as many other issues. Random blue screens, unexplained application crashes, and intermittent “out of memory” alerts are classic red flags. In my experience, a sudden surge of “PAGE_FAULT_IN_NONPAGED_AREA” errors often signals a failing module or an incorrectly set XMP profile. If your system freezes exactly when you launch a memory‑hungry IDE or spin up a large Docker container, that’s another clue. Pay attention to the pattern: does the crash happen after a specific amount of uptime, or only under heavy multi‑threaded loads? These observations help you decide whether you’re dealing with a hardware fault, a BIOS misconfiguration, or a software memory leak.
First‑Line BIOS Checks and Quick Diagnostics
The BIOS/UEFI is your first checkpoint. Modern firmware provides a built‑in memory test that, while not as exhaustive as third‑party tools, can quickly confirm whether the basics are solid. Boot into the firmware setup and verify that the memory frequency matches the manufacturer’s rating, and that the voltage is within the recommended range (usually 1.35 V for DDR5). Disable any aggressive power‑saving features like “Gear Down Mode” while troubleshooting; they can mask timing issues. If your board offers an “XMP Profile” toggle, turn it off and let the system run at JEDEC defaults. This often reveals whether an over‑clocked profile is the source of instability. Finally, make a note of the total detected capacity—if the BIOS sees only half of what you installed, you’ve already uncovered a hardware‑level problem.
Running MemTest86: The Gold Standard
Once the BIOS looks clean, it’s time to let a dedicated memory tester take over. MemTest86 is the go‑to utility for deep analysis; its latest 2026 release supports DDR5’s high frequencies and can run for multiple passes without user intervention. Create a bootable USB, select the “advanced” settings, and enable “ECC error checking” if your modules support it. Let the test run for at least four full passes—any errors, even a single one, indicate a faulty cell or a timing mismatch. Pay close attention to the error logs: “address mismatch” points to a specific module slot, while “parity error” often means voltage is too low. If errors only appear under higher frequencies, you may need to dial back the clock or increase the DRAM voltage incrementally, watching for thermal thresholds.
Physical Inspection: Reseat, Clean, and Verify Timings
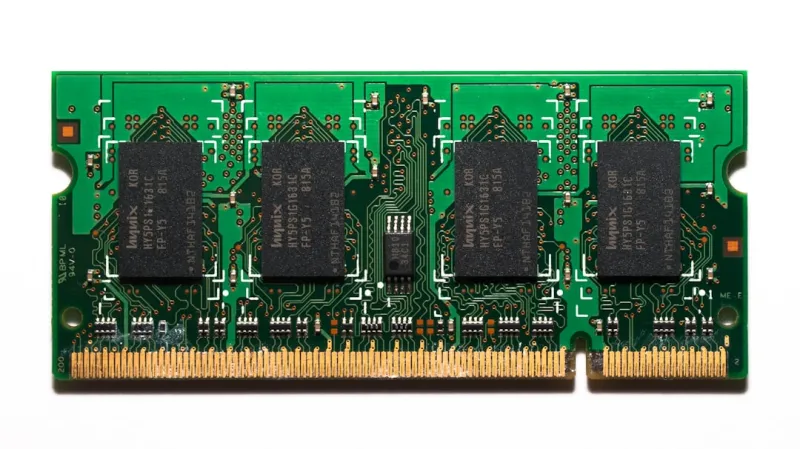
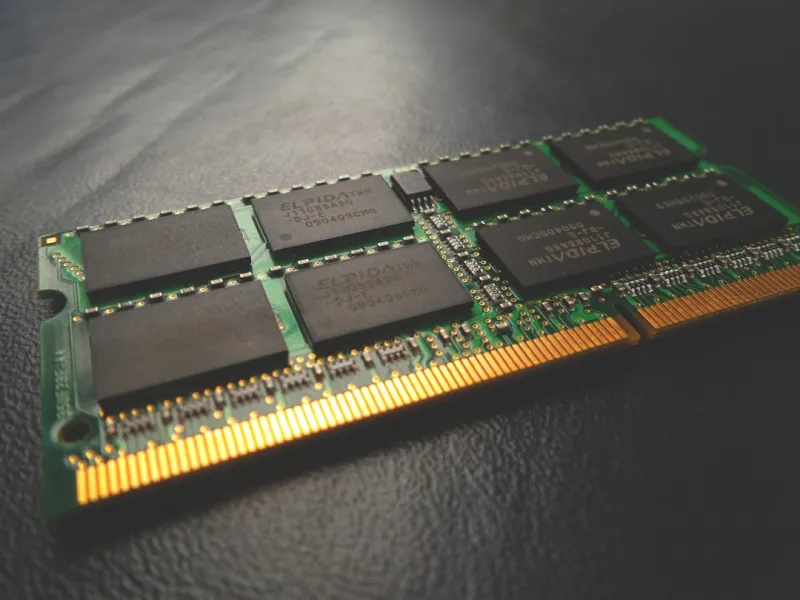
Hardware gremlins love dust and loose connections. Power down, unplug, and open your case. Carefully remove each DIMM, checking the gold contacts for oxidation or debris—an alcohol wipe can restore a clean surface. When reseating, align the notch precisely and apply even pressure until the clips snap into place; a partially seated stick will often cause intermittent detection. After reinstalling, revisit the BIOS to confirm that each module’s SPD (Serial Presence Detect) data matches the label on the stick. If the BIOS reports “unrecognized” for any slot, try moving the module to a different channel—sometimes a single slot on the motherboard is defective. While you’re there, verify that the timings (e.g., 36‑36‑36‑76) reflect the manufacturer’s specs; custom timings can be entered manually if you suspect the auto‑configuration is off.
Firmware Updates and Motherboard Compatibility
Even the most robust DDR5 kits can suffer from incompatibility with older firmware. Check your motherboard’s support list—most vendors publish a QVL (Qualified Vendors List) that outlines tested memory configurations. If your modules aren’t on that list, a BIOS update may add the necessary microcode to support the higher densities or the specific sub‑timings you’re using. Visit the manufacturer’s site, download the latest firmware, and follow the recommended flashing procedure. In 2026, many boards support “dual‑BIOS” to safeguard against a bad flash; take advantage of it. After updating, re‑run your memory tests; many stability issues that seemed hardware‑related have been resolved by a simple firmware bump. For deeper insight, read upgrade strategies for power users to see how future‑proofing your RAM choices ties into the broader system design.
Software‑Side Memory Management and Leak Detection
Hardware can be rock‑solid, yet your OS might still report “out of memory” due to leaks in applications or misconfigured virtual memory settings. In Windows 2026, the new “Dynamic Memory Optimizer” automatically adjusts the page file, but power users can still fine‑tune the allocation. Open the Performance Monitor, add counters for “Committed Bytes” and “Pool Non‑Paged Bytes,” and watch for steady growth during idle periods—this is a classic sign of a memory leak. Tools like Process Explorer let you isolate offending processes. On Linux, use htop and valgrind to trace allocation patterns. If a specific development environment consistently consumes more RAM after an update, consider rolling back or applying patches. Remember, memory leaks can masquerade as faulty RAM, so always rule out software before swapping hardware.
Putting It All Together: A Checklist for the Power‑User
When you’ve walked through the BIOS, run MemTest86, reseated modules, updated firmware, and cleared software leaks, you should have a clear picture of your memory health. Here’s a quick checklist to keep in your toolbox: 1) Verify BIOS reports the correct capacity and speed. 2) Run at least four passes of MemTest86 with ECC enabled if applicable. 3) Reseat all DIMMs, clean contacts, and confirm slot integrity. 4) Match timings and voltages to manufacturer specs; avoid aggressive XMP overclocks until stability is proven. 5) Update motherboard firmware to the latest version. 6) Monitor OS memory usage for leaks using built‑in diagnostics. 7) Document any errors and their associated modules for future reference. By following this systematic approach, you’ll not only fix the immediate issue but also build a resilient workstation that can handle the demanding AI and GPU workloads of 2026. Got a memory mystery of your own? Drop a comment—let’s troubleshoot together.