When your workstation starts throwing random freezes, stutters, or those dreaded “memory could not be read” errors, the culprit is often more than just a greedy application. As a power‑user who builds AI‑driven workstations, I’ve learned that RAM is the silent workhorse that can make or break productivity. In 2026, memory modules have become denser, with DDR5‑5600 and emerging DDR6‑7200 speeds promising unprecedented bandwidth. Yet the complexity of these modules also means new failure modes: timing mismatches, voltage instability, and even firmware bugs hidden deep in the SPD (Serial Presence Detect) data. Understanding the anatomy of modern RAM—ranks, chips, timings, and subtimings—gives you a diagnostic edge that generic troubleshooting guides often overlook. This article walks you through a systematic, power‑user‑centric approach to identifying, isolating, and fixing RAM issues before they derail critical AI or creative workloads.
Step‑One: Verify Physical Installation and Seating
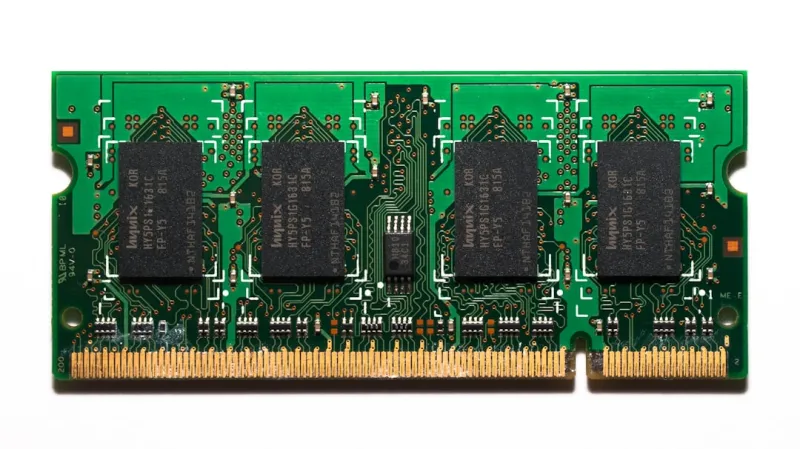
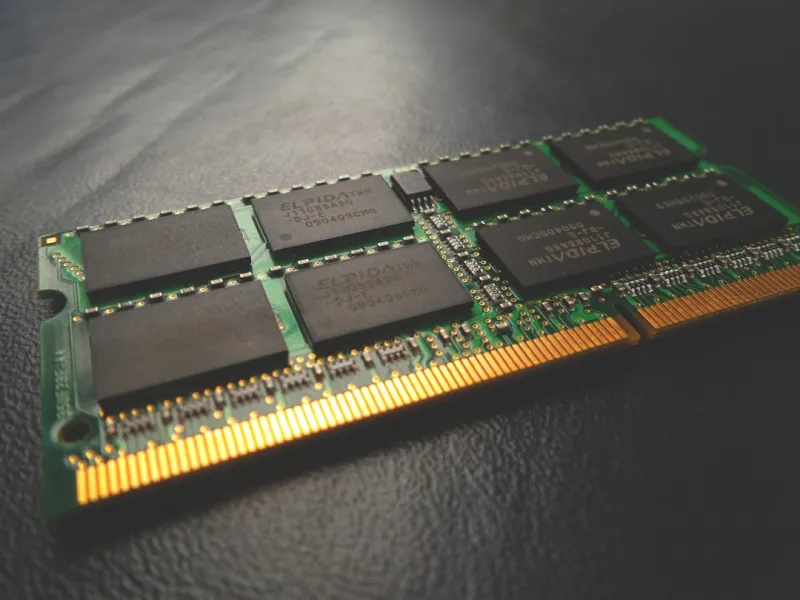
The first, often ignored, step is to confirm that every DIMM is firmly seated in its slot. In the era of high‑capacity 32 GB and 64 GB modules, manufacturers have introduced tighter tolerances that can lead to intermittent contacts, especially after frequent upgrades. Power‑users should power down, disconnect the PSU, and use a non‑static wrist strap while gently rocking each module to ensure full engagement of the retention clips. Don’t forget to inspect the slot for dust or debris; a simple air blast can prevent false positives during later testing. While you’re there, check the motherboard’s QVL (Qualified Vendor List) to confirm the specific module speeds and capacities are officially supported. A mismatch here can cause subtle timing errors that only surface under heavy AI model training loads.
Step‑Two: Run Low‑Level Memory Tests Outside the OS
Software tools that run within Windows, such as Task Manager’s memory tab, can miss hardware‑level faults. Bootable utilities like MemTest86 Pro provide a more exhaustive assessment, exercising each address line across multiple passes and varying patterns. In 2026, MemTest86 now supports testing DDR5/DDR6 ECC and non‑ECC modules with detailed error logs accessible via USB. Allocate at least four full passes—each taking roughly 30–45 minutes on a modern workstation—to catch intermittent errors. If errors appear, note the exact address and pattern; this data can help you pinpoint a defective chip or a specific rank that may need reseating or replacement. Remember to disable any XMP profiles during testing, as they can mask timing issues that would otherwise be visible.
Step‑Three: Leverage Built‑In Windows Diagnostics
Windows 11’s Windows Memory Diagnostic tool has been updated in 2026 to include deeper checks for DDR5‑5600 and beyond. Access it via the Start menu, run the test, and choose “Restart now and check for problems.” The utility logs results in the Event Viewer under “MemoryDiagnostics‑Results.” While not as thorough as MemTest86, it offers a quick sanity check, especially useful when you suspect a recent driver update triggered memory instability. Pair this with the Why Windows 11 Remains the Power User’s Playground in 2026 article for tips on configuring pagefile size and enabling “Hardware‑accelerated GPU scheduling,” which can also impact perceived RAM performance.
Step‑Four: Examine BIOS/UEFI Settings and Firmware Updates
Modern UEFI firmware provides granular control over memory timings, voltage, and sub‑timings. Power‑users often enable XMP (Extreme Memory Profile) to push modules to rated speeds, but in 2026 many boards ship with default aggressive profiles that can cause instability under AI workloads. Enter the BIOS, disable XMP, and manually set the base JEDEC timings and voltage (typically 1.35 V for DDR5‑5600). Run a quick MemTest86 pass after each adjustment to see if stability improves. Additionally, check the motherboard manufacturer’s website for BIOS revisions that address memory compatibility—especially for newer DDR6 modules. Firmware bugs can manifest as occasional “PCIe Bus Error” messages that actually stem from memory timing glitches.
Step‑Five: Diagnose Software‑Induced Memory Pressure
Even perfectly healthy RAM can appear faulty when software consumes it in unexpected ways. In 2026, AI frameworks like TensorFlow and PyTorch aggressively allocate VRAM and system RAM for model caching. Use Resource Monitor or the newer Performance Analyzer in Windows 11 to track “Commit” and “Hard Faults/sec.” A sudden spike in hard faults suggests the system is paging to disk, which can masquerade as RAM failure. Adjust the pagefile size manually—setting it to a fixed value (e.g., 1.5× total RAM) can reduce fragmentation. For developers, enable memory‑growth in TensorFlow to prevent pre‑allocation of the entire RAM pool. This proactive management often resolves what looks like a hardware problem without opening the case.
Step‑Six: Test for Voltage Fluctuations with a Multimeter
Power delivery is a silent killer of RAM stability. High‑performance DDR5 modules draw up to 1.5 A per DIMM, and a marginally under‑spec PSU can cause voltage droop under load. Use a digital multimeter or a dedicated power‑monitoring USB‑C device to measure the 12 V rail while running a stress test like Prime95’s Blend test. If you see the voltage dip below 11.8 V, consider upgrading to a PSU with a higher efficiency rating (80 PLUS Gold or Platinum). Also, enable “Memory Voltage” monitoring in the BIOS—some boards now display real‑time VDIMM readings, allowing you to spot anomalies before they cause errors.
Step‑Seven: When All Else Fails, Swap Modules Strategically
If diagnostics still point to a faulty DIMM, the most efficient method is to isolate it by swapping modules between slots. Start by populating the first two slots with a known‑good pair and run MemTest86. Then replace one module with the suspect DIMM, leaving the other slot empty, and retest. This “single‑module” approach helps determine whether the problem lies in the DIMM itself or the slot’s electrical path. Document each configuration in a simple spreadsheet—record slot numbers, module part numbers, and test results. This systematic logging saves time, especially when you have multiple kits on hand or need to claim warranty replacements.
Step‑Eight: Future‑Proof Your Memory Strategy
Looking ahead, the best defense against RAM‑related downtime is a proactive upgrade plan. In 2026, many power‑users are adopting a “dual‑channel plus” strategy, populating four slots with matched kits to maximize bandwidth for AI inference tasks. Pair this with a motherboard that supports “Memory Over‑Provisioning,” allowing you to allocate extra spare capacity for future DDR6 upgrades. For detailed guidance, check out Future‑Proof Your PC: Upgrade Strategies Power Users Swear By. By planning for a 128 GB baseline and keeping an eye on emerging DDR6‑7200 kits, you can avoid the frantic scramble when your workloads outgrow current memory limits.
Step‑Nine: Document and Automate Routine Checks
As a power‑user, your time is valuable, so automate the health‑check process. Create a simple PowerShell script that runs Get‑WmiObject Win32_PhysicalMemory to log SPD data, executes MemTest86 in unattended mode, and parses the Event Viewer for memory diagnostic entries. Schedule the script to run weekly via Task Scheduler, and configure it to email you a concise report. This proactive approach not only catches early‑stage degradation but also builds a historical log that can be invaluable when dealing with warranty claims or vendor support. In the era of AI‑augmented diagnostics, some tools even feed these logs into a machine‑learning model that predicts failure probability based on temperature, voltage, and error patterns.
Conclusion: Turn RAM Troubles into an Advantage
Memory issues can feel like a roadblock, but for a power‑user they’re an opportunity to deepen system knowledge and build resilience. By following a methodical, eight‑step process—from physical inspection to automated monitoring—you can turn ambiguous freezes into actionable data. In 2026’s fast‑moving AI and content‑creation landscape, a stable RAM foundation is non‑negotiable. Embrace the diagnostic mindset, stay current with BIOS updates, and keep a strategic upgrade roadmap. Your next breakthrough—whether it’s training a massive language model or rendering 8K video—will thank you for the extra minutes you invested in solidifying the memory stack today.