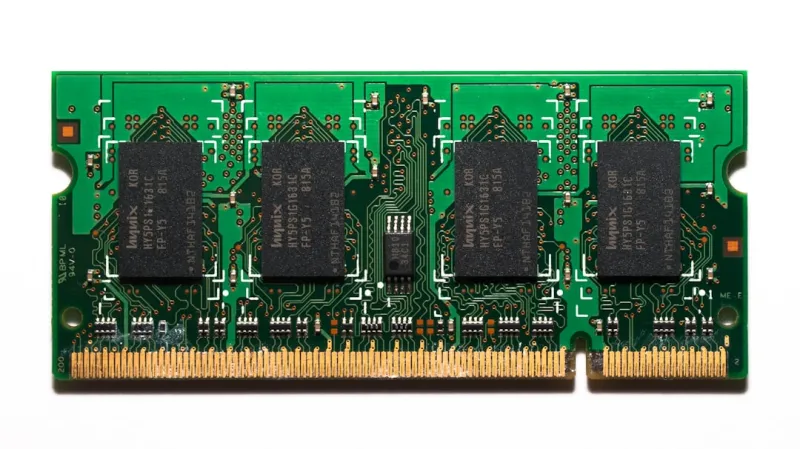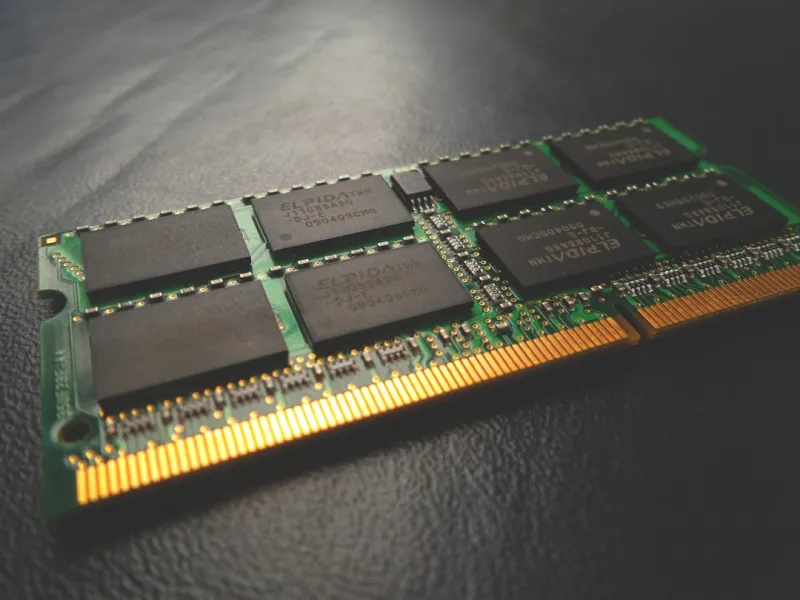

When my workstation started throwing “Out of memory” warnings despite having a hefty 64 GB kit installed, I knew the issue wasn’t just a software hiccup. As a power user who lives on the edge of performance, I treat RAM like the lifeblood of my machine—every glitch is a symptom of a deeper imbalance. In 2026, the sheer variety of DDR5 modules, mixed‑frequency kits, and aggressive XMP profiles means troubleshooting memory is more nuanced than ever. First, I verify that the BIOS recognizes every stick at the correct speed; a quick glance at the UEFI firmware screen can reveal if a module is down‑clocked to DDR4 compatibility mode by accident. From there, I run a two‑stage diagnostic: Windows Memory Diagnostic for a quick sanity check, followed by a full‑blown MemTest86 boot‑able scan that stresses each address line for hours. If any errors appear, I isolate the faulty DIMM by swapping slots, noting that even a single bad chip can corrupt an entire channel, leading to the dreaded blue screen of death.
Understanding the Architecture: Channels, Ranks, and Timings
Before you start swapping modules, it helps to grasp how modern DDR5 architecture distributes data. A typical quad‑channel board can run two DIMMs per channel, each DIMM often split into multiple ranks. When you mix ranks with differing densities, the memory controller may default to the lowest common denominator, throttling bandwidth and inflating latency. This is why I always double‑check that all sticks share the same rank count and are sourced from the same vendor. Moreover, the SPD (Serial Presence Detect) data on each module holds timing parameters—CAS latency, tRCD, tRP—that the BIOS uses to negotiate stable operation. If you’ve manually enabled an aggressive XMP profile, you might be pushing timings beyond what your motherboard’s power delivery can sustain, causing occasional “random reboot” events that masquerade as memory errors. The trick is to start with the JEDEC standard timings, verify stability, then incrementally tighten the settings while monitoring temperatures on the VRM and DRAM.
Boot‑Level Tools: From Windows to Linux
While Windows Memory Diagnostic is convenient, it only scratches the surface. For power users, I recommend booting a Linux live environment and using memtester or the stress-ng suite, which let you allocate specific memory blocks and apply custom stress patterns. This approach reveals issues that only manifest under sustained, high‑throughput workloads—like those you’d see while rendering 8K video or compiling massive codebases. Additionally, tools like HWInfo 7.0 (the 2026 edition) can report real‑time DRAM voltage and temperature, helping you spot voltage droops that might trigger ECC-like errors on non‑ECC consumer kits. If you suspect a timing mismatch, the dmidecode command will expose the exact SPD profile currently active, allowing you to compare it against the manufacturer’s specifications. Remember, even a slight voltage sag of 0.02 V can cascade into data corruption under heavy load, so keep an eye on the VRM heat sink and consider adding a dedicated DRAM voltage regulator module if you’re pushing the limits.
Software Side: Drivers, Firmware, and OS Settings
Modern operating systems have become smarter about memory management, but they also introduce new failure points. In 2026, Windows 11’s Memory Compression feature can mask underlying hardware issues by silently compressing idle pages, leading you to think the system is fine while the RAM is actually misbehaving. I disable compression via the PowerShell cmdlet Disable-MemoryCompression when I’m in diagnostic mode. On the Linux side, the zswap and zram modules serve a similar purpose; turning them off ensures that any page faults you see are genuine hardware signals. Firmware updates are equally critical—many motherboard vendors released BIOS patches this year that improve DDR5 stability on newer Ryzen 9 and Intel 13th‑gen platforms. Always cross‑reference the Upgrade Playbook for the latest BIOS version recommendations, and keep your chipset drivers fresh to avoid obscure memory‑related bugs that can surface after a Windows update.
Identifying Memory Leaks in Applications
Even with flawless hardware, a misbehaving application can exhaust RAM, making it seem like a physical problem. As a power user, I regularly profile my workload with the Windows Performance Analyzer (WPA) and Linux’s valgrind suite to pinpoint processes that fail to release memory. A classic culprit in 2026 is the new wave of AI‑assisted plugins for IDEs, which allocate massive tensors for on‑the‑fly inference. If you notice a sudden spike in “Private Bytes” for a specific process, isolate it and test the same task on a clean boot. Often, simply updating the app or adjusting its cache settings resolves the leak. For developers, enabling the Memory Leak Detection flag in Visual Studio or using the AddressSanitizer can catch hidden pointers that cause heap fragmentation, which over time leads to “out of memory” errors even when plenty of free RAM appears in the task manager.
When to Consider ECC or Higher‑Capacity Kits
If you’re routinely pushing the limits—running VMs, large datasets, or real‑time simulation—consider upgrading to ECC (Error‑Correcting Code) memory, even on consumer platforms that now support it via BIOS toggles. ECC can correct single‑bit errors on the fly, dramatically reducing the chance of silent data corruption that’s hard to trace back to RAM. In 2026, AMD’s X670E and Intel’s Z790 boards have begun offering native ECC support for non‑server CPUs, making the transition smoother. However, ECC modules are pricier and sometimes run at slightly higher latencies. Weigh the trade‑off: if you’re a content creator or researcher handling critical data, the extra stability is worth the cost. For most gamers, a well‑tuned non‑ECC kit with robust cooling will suffice, but always keep an eye on the error logs in Event Viewer or dmesg for any “Corrected ECC error” entries that hint at underlying instability.
Physical Inspection and Maintenance
Dust is the silent assassin of high‑performance RAM. The tiny heat spreaders on DDR5 modules can accumulate static‑charged particles, leading to hot spots that degrade signal integrity. I recommend a quarterly cleaning routine: power down, unplug, and use a low‑static brush to gently remove debris from the DIMM slots. While you’re at it, reseat each stick to ensure the contacts are fully engaged; a slight misalignment can cause intermittent errors that only show up under load. Thermal pads on high‑performance kits also age; swapping them for newer, higher‑conductivity pads can lower DRAM temps by a few degrees, which translates to better stability when you’re overclocking. Finally, check the motherboard’s slot population guidelines—some boards recommend populating slots in a specific order to balance the electrical load across the memory controller, a detail that’s easy to overlook but can be the difference between a smooth run and a crash.
Advanced Tuning: Leveraging BIOS Profiles and Software Utilities
Once you’ve confirmed the hardware is sound, you can extract every ounce of performance with careful BIOS tuning. Start by enabling the “Memory Timings Calibration” feature, which runs a quick algorithm to find the lowest stable latency for your specific kit. Next, adjust the DRAM voltage in small increments—typically 1.35 V is safe for DDR5, but some kits benefit from a modest bump to 1.40 V under heavy XMP settings. Use the Operating System Mastery for Power Users guide to align Windows’ Power Plan with the memory profile, setting the “Processor performance boost mode” to “Aggressive” so the CPU can keep up with faster RAM. On the software side, utilities like Ryzen Master or Intel’s Extreme Tuning Utility let you fine‑tune memory clocks in real time, providing instant feedback on stability via built‑in stress tests. Remember to document each change; a systematic approach prevents you from chasing ghosts when a later tweak reintroduces instability.
When All Else Fails: Knowing When to Replace
After exhausting diagnostics, sometimes the simplest answer is to replace the memory. Even brand‑new modules can be DOA, especially when sourced from third‑party sellers who might have mishandled the inventory. In 2026, many manufacturers now include a QR code on the module that links directly to a live warranty verification portal—use it to confirm you’re covered. If you’re still under warranty, file a RMA with clear logs from MemTest86 and the BIOS error messages you captured. While waiting for a replacement, keep a spare kit on hand; swapping in a known‑good set can keep your workflow uninterrupted. And as a final tip, maintain a “memory health log” in your favorite note‑taking app, noting the date of purchase, firmware version, and any quirks you discover. This habit not only speeds up future troubleshooting but also provides valuable data for the community when you share your findings on forums or in blog posts.