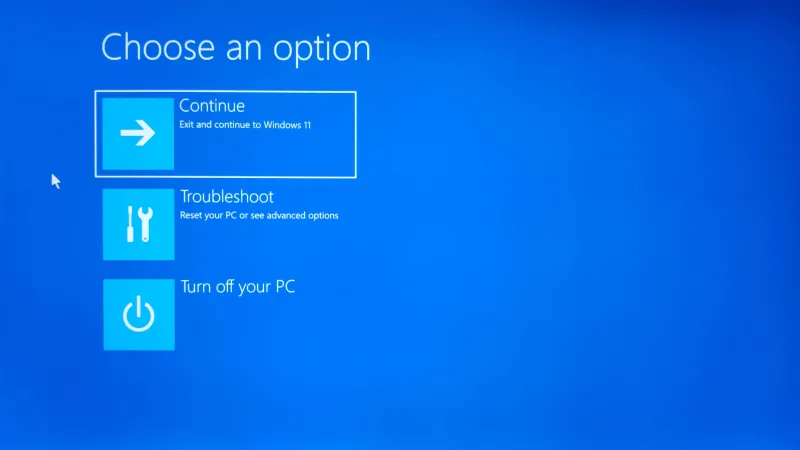
When my workstation flashed that infamous cobalt tide last month, I felt a flash of déjà vu mixed with a surge of adrenaline. As a power‑user who spends countless hours tweaking BIOS settings, overclocking GPUs, and automating builds, I’ve learned that a blue screen isn’t just a nuisance—it’s a clear‑cut alarm bell screaming that something deep under the hood has gone rogue. In 2026, despite the sleek aesthetics of Windows 12 and the promise of “zero‑downtime” updates, the dreaded STOP error still pops up like an unwelcome pop‑up ad from the early 2000s. My first instinct was to blame the latest driver I’d installed, but the reality was far more layered. In this post, I’ll walk you through the modern anatomy of a blue screen, share the exact diagnostic workflow that saved me hours of frustration, and show you how to turn each crash into a learning opportunity rather than a productivity sinkhole.
The Blue Screen’s Evolution: From Cry for Help to Diagnostic Goldmine
Back in the era of Windows 7, a blue screen was a blunt, almost theatrical statement: “Your PC just died.” Fast‑forward to 2026, and the STOP code has transformed into a granular report packed with memory addresses, driver identifiers, and even suggested remediation steps. Microsoft now embeds a QR code on the screen that links directly to an online knowledge base, but the real power lies in the kernel dump that the system writes to disk. This file, typically named MEMORY.DMP, holds a snapshot of the system’s memory at the exact moment of failure, allowing seasoned users to dissect the fault line with surgical precision. While casual users might ignore it, power‑users can extract priceless insights about which subsystem—be it the storage stack, network driver, or a rogue piece of malware—triggered the crash. Understanding this evolution is essential; it turns a seemingly opaque error into a roadmap for fixing the root cause rather than merely rebooting and hoping for the best.
Common Culprits: Drivers, Memory, Malware, and More
In my experience, the most frequent offenders are outdated or incompatible drivers, especially after a major OS update. A new graphics driver that promises 4K gaming at 240 Hz can inadvertently clash with a legacy SATA controller, sending the system into a panic loop. Next up is volatile memory; a single faulty RAM module can corrupt critical system structures, resulting in cryptic STOP codes like 0x0000001A. Storage issues, too, are sneaky—corrupt sectors on an NVMe drive can masquerade as driver faults. And let’s not forget modern malware, which has become adept at targeting power‑users by infiltrating high‑privilege processes. For a deeper dive into how malicious code exploits our elevated permissions, check out Why Modern Malware Targets Power Users—and How to Stay One Step Ahead. By categorizing these root causes, you can prioritize your troubleshooting steps and avoid the endless “turn it off and on again” cycle that wastes precious development time.
First‑Line Defense: Safe Mode, Event Viewer, and Dump Analysis
The moment you see that electric blue, the first thing I do is boot into Safe Mode. This stripped‑down environment loads only essential drivers, allowing you to verify whether the crash is tied to a third‑party component. Once in Safe Mode, the Windows Event Viewer becomes your best friend; filter for “Critical” events under the “System” log and look for entries that reference “BugCheck.” These entries often contain the STOP code and a list of implicated drivers, giving you a quick hint before you even touch the dump file. If you’re comfortable with command‑line tools, the wmic utility can extract the most recent crash dump location, which you can then feed into a debugger like WinDbg. Remember to set the symbol path to Microsoft’s online symbol server—this ensures that the debugger can translate cryptic memory addresses into human‑readable function names. By mastering these first‑line diagnostics, you’ll cut down the time spent chasing red herrings and move straight to the heart of the problem.
Deep Dive with WinDbg: Turning Dumps into Actionable Insight
Now that you’ve isolated the dump file, it’s time to let WinDbg do the heavy lifting. Launch the tool, load the MEMORY.DMP, and execute the !analyze -v command. The output will highlight the “Probably caused by” section, which pinpoints the driver or module most likely responsible. If you see a reference to nvlddmkm.sys, for example, you know the Nvidia graphics stack is at fault. For a more thorough walkthrough, I highly recommend reading Decoding the Blue Screen: A Power‑User’s Survival Guide, which walks you through interpreting the call stack, checking for memory corruption, and even automating the analysis with PowerShell scripts. One trick I’ve found invaluable is creating a custom “crash‑analysis” script that pulls the STOP code, driver name, and suggested fix into a concise email that I can forward to my team’s ticketing system. This not only streamlines the remediation process but also builds a knowledge base that future you can reference when a similar issue reappears.
Hardware Health Checks: Memory, Storage, and Motherboard Integrity
Even the most meticulously maintained software stack can be tripped up by faulty hardware. In 2026, we still see RAM modules that fail under sustained loads, especially when pushed beyond JEDEC specifications for higher frequencies. I run the Windows Memory Diagnostic tool weekly, but for a deeper probe I use MemTest86+ boot‑able media, which can stress test each memory bank for hours. Storage health is equally critical; a SMART‑enabled NVMe SSD can report impending failure long before a blue screen appears. Tools like CrystalDiskInfo can parse these metrics and alert you to re‑allocation events or wear‑level thresholds. Lastly, the motherboard’s BIOS/UEFI firmware can be a hidden source of instability—outdated firmware may not fully support the latest CPU power‑management features, leading to erratic behavior. Keeping the BIOS up to date, while ensuring you have a reliable backup of your current settings, is a habit that has saved me from countless obscure crashes.
Preventive Strategies: Updates, Backups, and Encryption Without Slowdowns
Prevention is always better than cure, especially when a blue screen can erase unsaved work in seconds. I follow a strict cadence: driver updates on the first Tuesday of each month, BIOS firmware checks quarterly, and OS patches as soon as Microsoft releases them—preferably after a quick test on a non‑critical machine. Automated backups are non‑negotiable; using a hybrid approach of local snapshots via VSS and cloud‑based versioning ensures I can roll back to a known‑good state without data loss. Encryption, too, often gets a bad rap for slowing down performance, but modern AES‑256 hardware acceleration on today’s CPUs makes it virtually invisible. By enabling BitLocker with TPM support, I protect sensitive data without sacrificing the speed needed for my intensive workloads. These layered safeguards dramatically reduce the frequency of blue screens, turning them from a daily dread into a rare, manageable event.
Workflow Resilience: Virtualization, Snapshots, and Redundant Environments
Even with all the preventive measures, crashes can still happen—especially when testing bleeding‑edge software or drivers. To minimize the impact on my primary workstation, I run risky workloads inside virtual machines (VMs) using Hyper‑V with nested virtualization support. Each VM is backed by a snapshot that captures the exact system state before I install a new driver or run a stress test. If the VM hits a STOP error, I can simply revert to the previous snapshot in seconds, preserving the host’s stability. For mission‑critical tasks, I maintain a secondary, identical workstation that stays in sync via RAID‑1 mirroring and daily image backups. This redundancy ensures that a blue screen on one machine never translates to downtime for my clients or development pipelines. By designing a workflow that isolates potential failures, you keep the creative momentum flowing even when the OS decides to throw a tantrum.
Turning Crashes Into Knowledge: Building a Community of Power‑User Resilience
Every blue screen is an opportunity to refine your troubleshooting playbook and share insights with the broader power‑user community. I keep a living document on my internal wiki that logs each STOP code, the suspected cause, and the final fix—complete with links to relevant blog posts, like the ones mentioned earlier. This repository not only helps my team diagnose future issues faster but also serves as a teaching tool for newer colleagues who are still learning the ropes. If you’ve faced a particularly stubborn crash, I encourage you to comment below or contribute to the discussion on our forum. Together, we can demystify the blue screen, turning it from a dreaded roadblock into a catalyst for deeper system mastery. Stay curious, stay prepared, and remember: a well‑armed power‑user never lets a blue screen win.